Regression Coefficients and Coefficient of Determination (R-squared)
Regression Coefficients and Coefficient of Determination (R-squared)
In regression analysis, two important concepts are regression coefficients and the coefficient of determination (R-squared). While both are crucial in understanding and interpreting regression models, they serve different purposes and provide distinct insights.
Regression Coefficients
Regression coefficients are the numerical values that describe the relationship between the independent variables (predictors) and the dependent variable in a regression model. In a linear regression model, these coefficients represent the slope of the line that best fits the data.
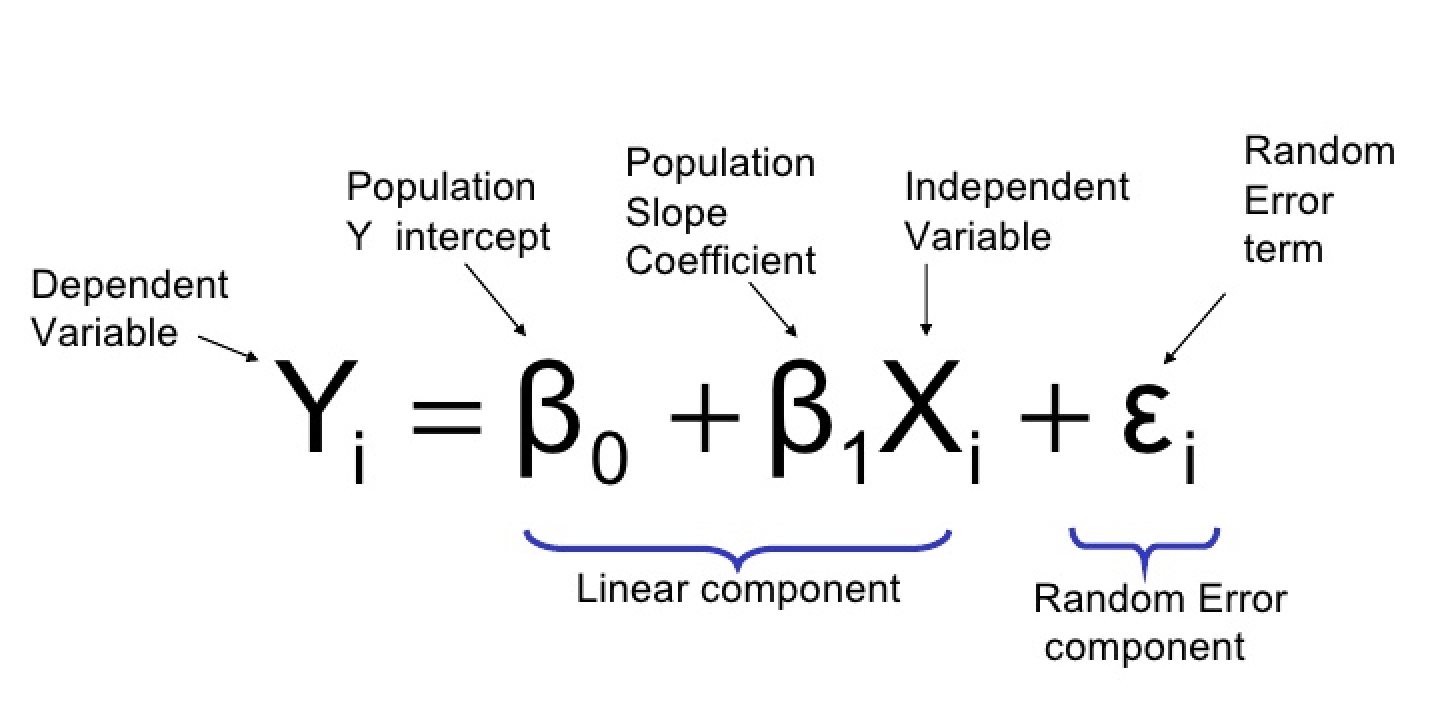
Formula: For a simple linear regression model: Y = β₀ + β₁X + ε
Where: Y is the dependent variable X is the independent variable β₀ is the y-intercept (constant term) β₁ is the regression coefficient ε is the error term
Interpretation:
- β₀ (y-intercept): The expected value of Y when X is zero.
- β₁ (slope): The change in Y for a one-unit increase in X.
For multiple linear regression: Y = β₀ + β₁X₁ + β₂X₂ + ... + βₖXₖ + ε
Where: X₁, X₂, ..., Xₖ are k independent variables β₁, β₂, ..., βₖ are the corresponding regression coefficients
Calculation: For simple linear regression, the coefficients can be calculated using the following formulas:
β₁ = (n∑XY - ∑X∑Y) / (n∑X² - (∑X)²) β₀ = (∑Y - β₁∑X) / n
Where n is the number of observations.
Coefficient of Determination (R-squared)
The coefficient of determination, denoted as R², is a statistical measure that represents the proportion of the variance in the dependent variable that is predictable from the independent variable(s). It provides an indication of how well the regression model fits the observed data.
Formula: R² = 1 - (SSR / SST)
Where: SSR is the sum of squared residuals SST is the total sum of squares
Alternatively, it can be expressed as:
R² = (SST - SSR) / SST = SSM / SST
Where SSM is the sum of squares due to the model.
Sometimes, SSR is called SSE.

Interpretation:
- R² ranges from 0 to 1.
- An R² of 0 indicates that the model explains none of the variability in the data.
- An R² of 1 indicates that the model explains all the variability in the data.
- Generally, a higher R² suggests a better fit of the model to the data.
Calculation: R² = 1 - [∑(yᵢ - ŷᵢ)² / ∑(yᵢ - ȳ)²]
Where: yᵢ are the observed values ŷᵢ are the predicted values ȳ is the mean of the observed data
Key Differences:
-
Purpose:
- Regression Coefficients: Describe the relationship between individual independent variables and the dependent variable.
- R-squared: Measures the overall fit of the model to the data.
-
Interpretation:
- Regression Coefficients: Indicate the change in the dependent variable for a one-unit change in the independent variable, holding other variables constant.
- R-squared: Represents the proportion of variance in the dependent variable explained by the model.
-
Range:
- Regression Coefficients: Can be any real number (positive, negative, or zero).
- R-squared: Always between 0 and 1.
-
Units:
- Regression Coefficients: Expressed in the units of the variables.
- R-squared: Unitless, expressed as a proportion or percentage.
-
Number:
- Regression Coefficients: One for each independent variable in the model.
- R-squared: A single value for the entire model.
Table: Comparison of Regression Coefficients and R-squared
| Aspect | Regression Coefficients | R-squared (Coefficient of Determination) |
|---|---|---|
| Purpose | Describe individual variable relationships | Measure overall model fit |
| Interpretation | Change in Y per unit change in X | Proportion of variance explained |
| Range | Any real number | 0 to 1 |
| Units | Units of the variables | Unitless (proportion or percentage) |
| Number per model | One per independent variable | One for the entire model |
| Affected by scale | Yes | No |
Example: Let's consider a simple linear regression model predicting house prices based on square footage.
Regression equation: Price = β₀ + β₁(Square Footage) + ε
Suppose we find: β₀ = 50,000 β₁ = 100 R² = 0.75
Interpretation:
- Regression Coefficient (β₁): For every one square foot increase in house size, the price is expected to increase by $100, on average.
- Y-intercept (β₀): A house with zero square feet (theoretical) would be expected to cost $50,000.
- R-squared: 75% of the variability in house prices can be explained by the square footage of the house.
In this example, the regression coefficient provides specific information about the relationship between house size and price, while R-squared gives an overall measure of how well the model fits the data.
Limitations and Considerations:
-
Regression Coefficients:
- Can be affected by multicollinearity in multiple regression.
- May not capture non-linear relationships.
- Interpretation can be challenging when variables are on different scales.
-
R-squared:
- Does not indicate whether the coefficients are biased.
- Can increase with the addition of variables, even if they're not meaningful (adjusted R-squared addresses this).
- A high R-squared doesn't necessarily mean the model is good or predictive.
In conclusion, both regression coefficients and the coefficient of determination are essential tools in regression analysis, but they serve different purposes. Regression coefficients provide detailed insights into the relationships between individual variables, while R-squared offers a broader view of the model's overall explanatory power. Understanding both concepts is crucial for a comprehensive interpretation of regression models and their practical applications in various fields such as economics, social sciences, and natural sciences.